Please note, the indicators below are experimental and aim to create valuation approaches for the new asset class of Bitcoin. These charts are built as informative guides. There is no guarantee certain rules within each model will continue to apply as Bitcoin progresses along its adoption journey.
Any information on this site is not to be considered as financial advice. Please review the Disclaimer section for more information.
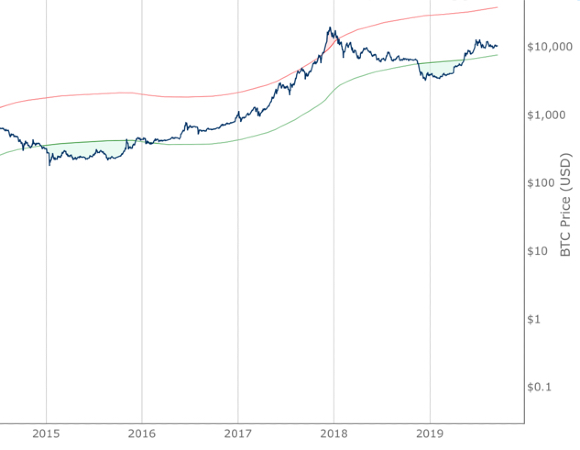
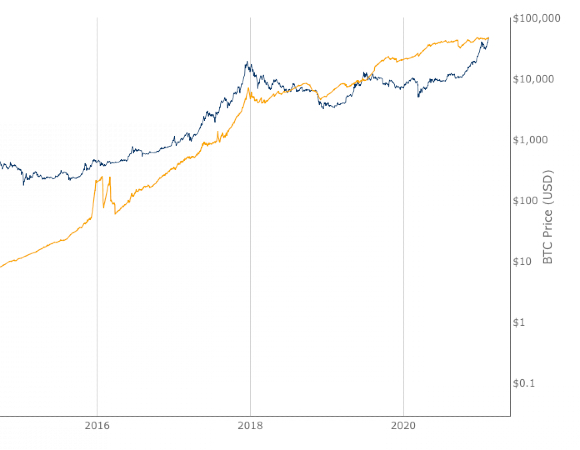
Long timeframe investor tool to identify under/oversold price periods
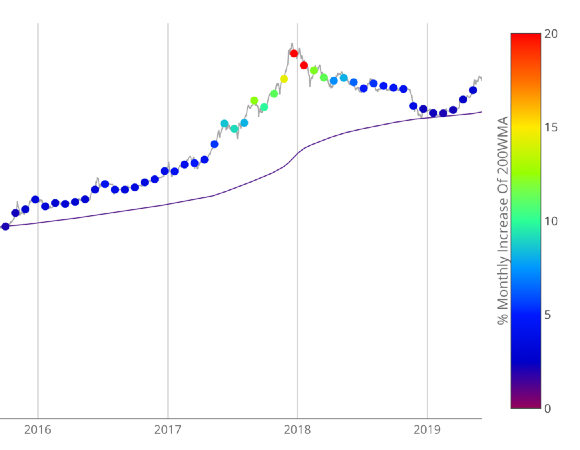
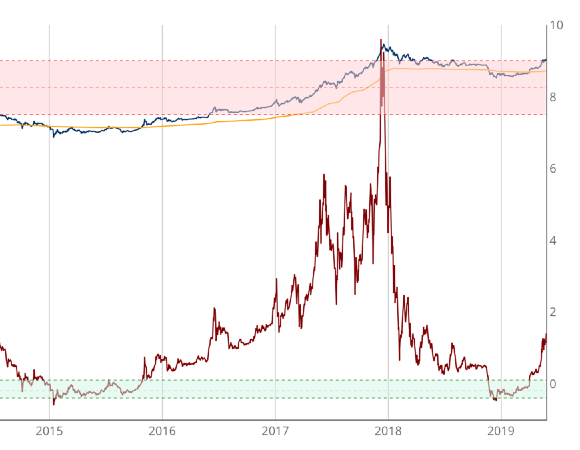
A simple heatmap system based on movements of the 200 week moving average.
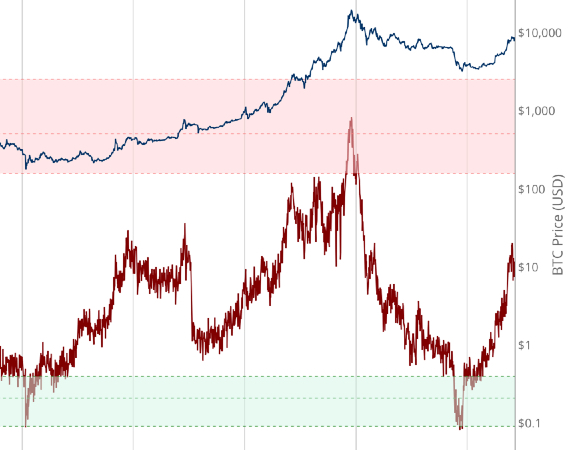
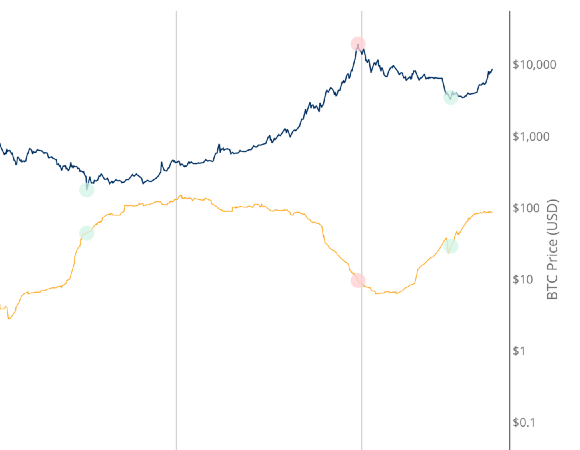
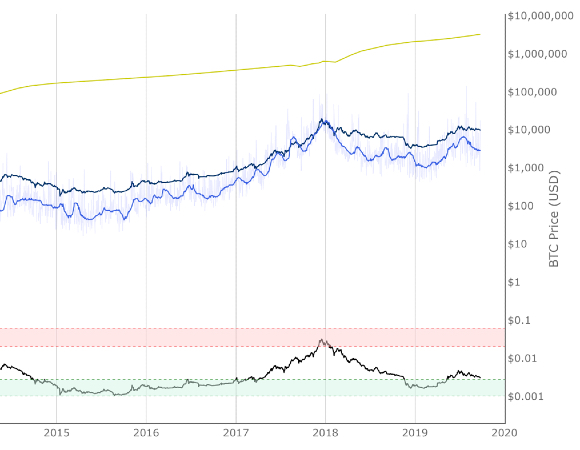
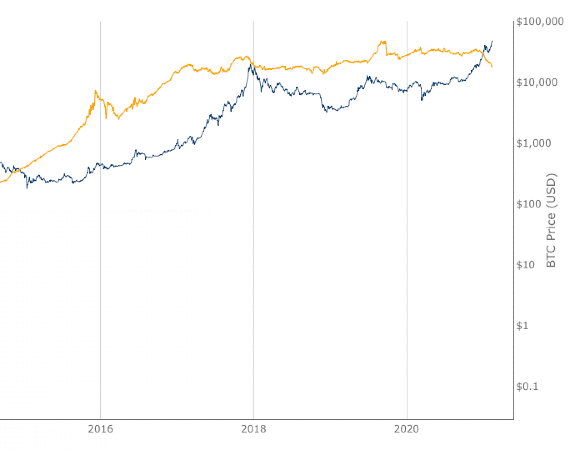
Relationship between daily bitcoin issuance and price.
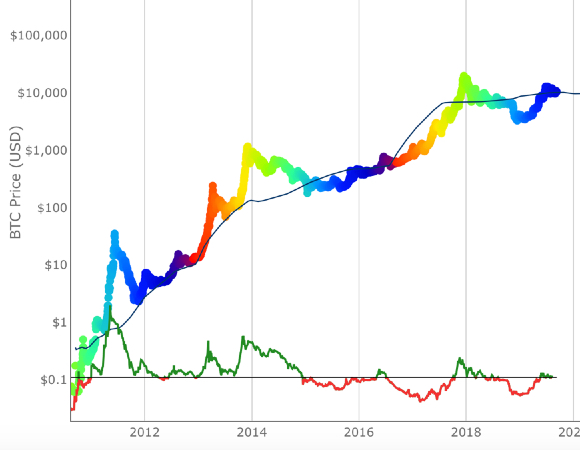
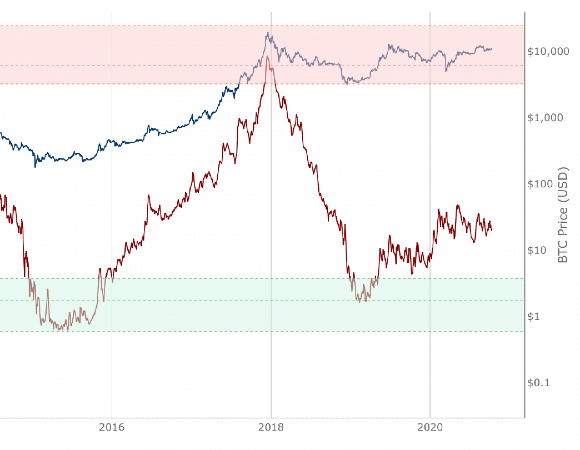
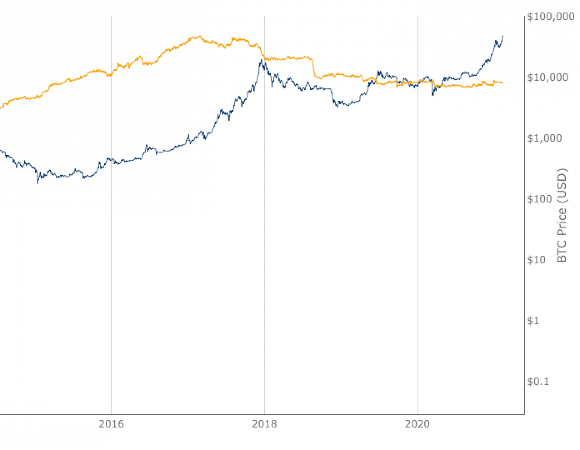
Ratio of bitcoins in circulation relative to the amount of bitcoins annually mined, and this ratio's relationship with price
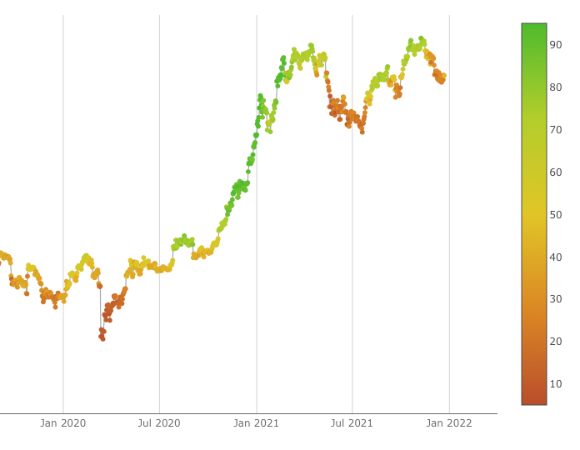
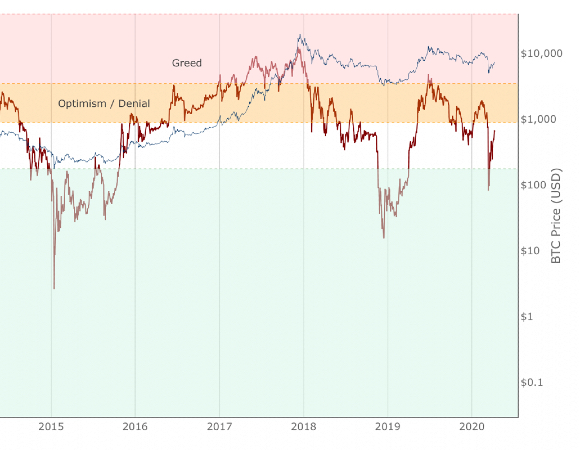
Market sentiment tool gauging investor fear and greed over time.
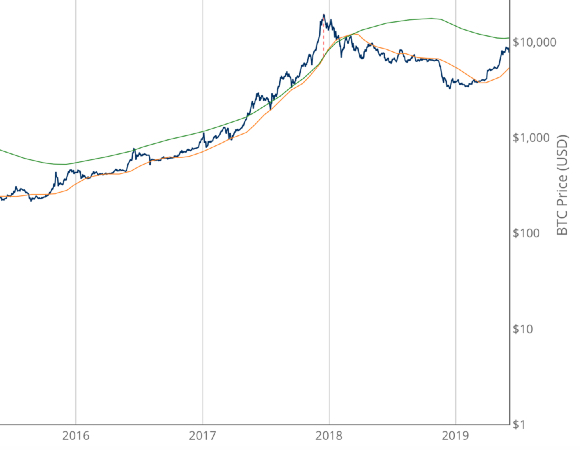
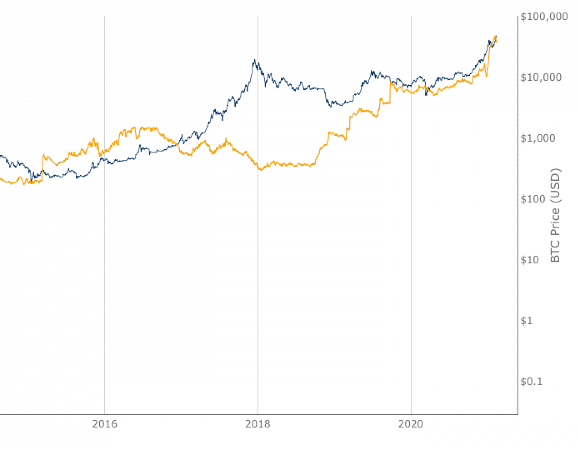
Moving average and moving average multiples to pick market cycle highs to within 3 days.
Uses Bitcoin's growth adoption curve and market cycles to identify both intracycle and full-cycle price highs.
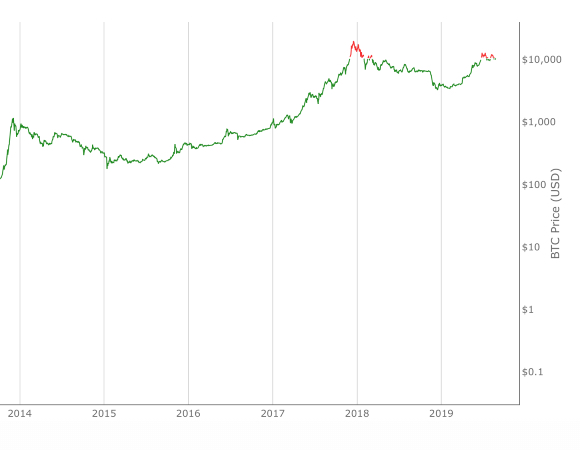
The proportion of days in Bitcoin's traded history that it has been profitable to hold Bitcoin
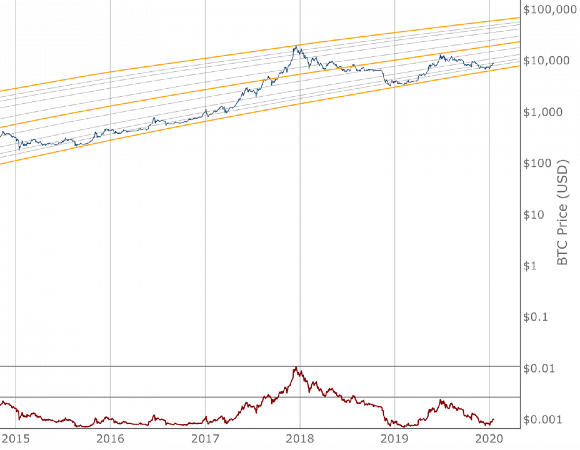
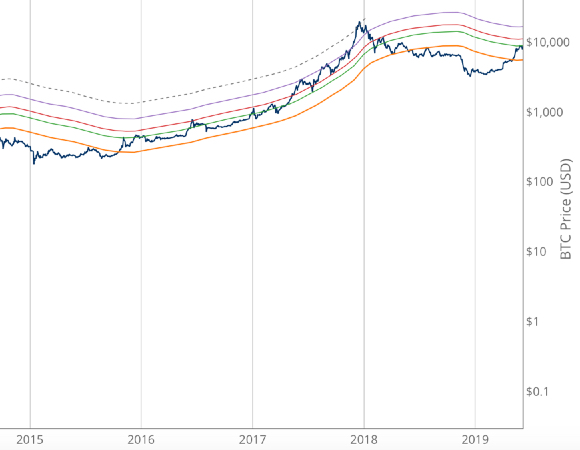
Bitcoin logarithmic growth curves
View of the percentage of coins HODL'd on the blockchain for over 1 year.
Pulls apart differences between Market Value and Realised Value to identify market cycle highs and lows.
On Chain Indicator using Realized HODL Ratio鈥檚 to identify cycle high price tops.
On-chain indicator for investor sentiment market stages
Long term Bitcoin investor confidence relative to Bitcoin price.
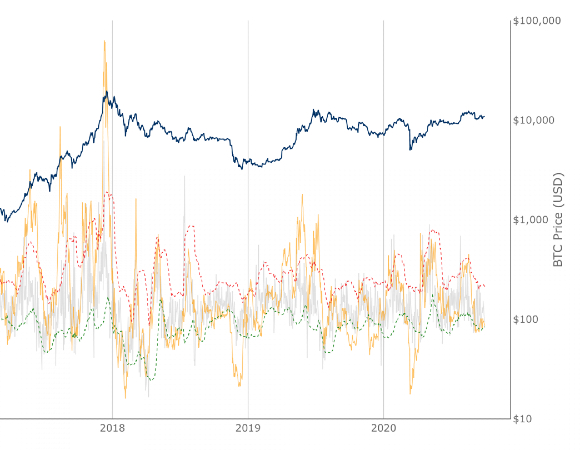
Comparing change in price with change in number of addresses to determine if Bitcoin is over/undervalued in the short term.
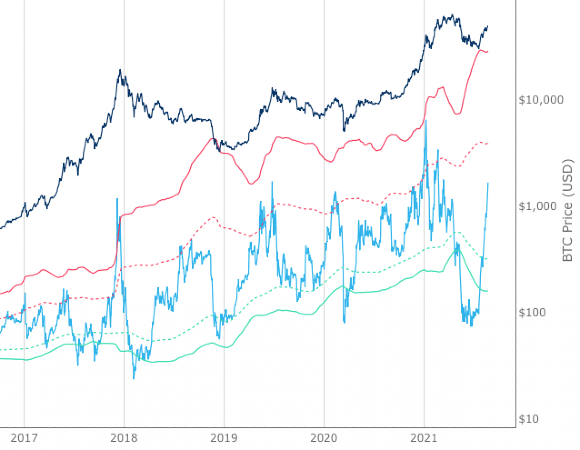
This adaptation of NVT Signal adds standard deviation bands to identify when Bitcoin is overbought or oversold.
Live chart showing the number of unique addresses holding at least 1BTC.
Live chart showing the number of unique addresses holding at least 10BTC.
Live chart showing the number of unique addresses holding at least 100BTC.
Live chart showing the number of unique addresses holding at least 1,000BTC.
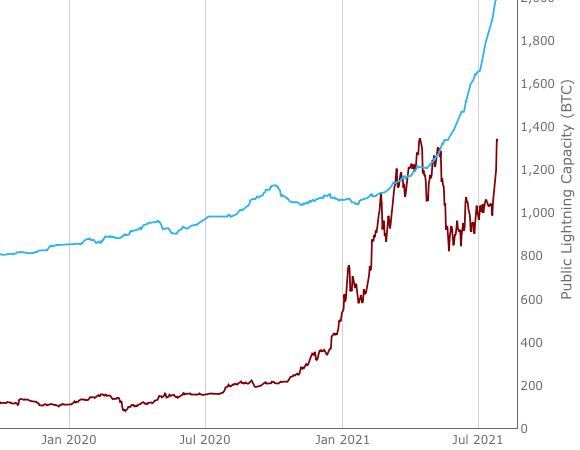
Cumulative capacity held by all nodes on the Lightning Network.
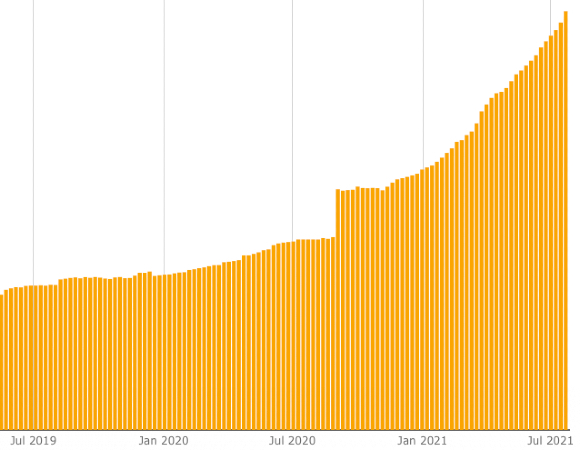
Total number of Bitcoin Lightning nodes.