Source: lookintobitcoin.com
It uses three metrics:
1. Market Value (blue line): The current price of Bitcoin multiplied by the number of coins in circulation. This is like market cap in traditional markets i.e. share price multiplied by number of shares.
2. Realised Value (orange line): Rather than taking the current price of Bitcoin, Realised Value takes the price of each Bitcoin when it was last moved i.e. the last time it was sent from one wallet to another wallet. It then adds up all those individual prices and takes an average of them. It then multiplies that average price by the total number of coins in circulation.
In doing so, it strips out the short term market sentiment that we have within the Market Value metric. It can therefore be seen as a more 'true' long term measure of Bitcoin value which Market Value moves above and below depending on the market sentiment at the time.
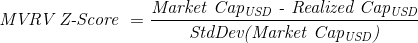
3. Z-score (red line): A standard deviation test that pulls out the extremes in the data between market value and realised value.
It also shows when market value is far below realised value, highlighted by z-score entering the green box. Buying Bitcoin during these periods has historically produced outsized returns.
He built on the initial work to create MVRV by Murad Mahmudov and David Puell
Any information on this site is not to be considered as financial advice. Please review the Disclaimer section for more information.