Please note, the indicators below are experimental and aim to create valuation approaches for the new asset class of Bitcoin. These charts are built as informative guides. There is no guarantee certain rules within each model will continue to apply as Bitcoin progresses along its adoption journey.
Any information on this site is not to be considered as financial advice. Please review the Disclaimer section for more information.
View of the percentage of coins HODL'd on the blockchain for over 1 year.
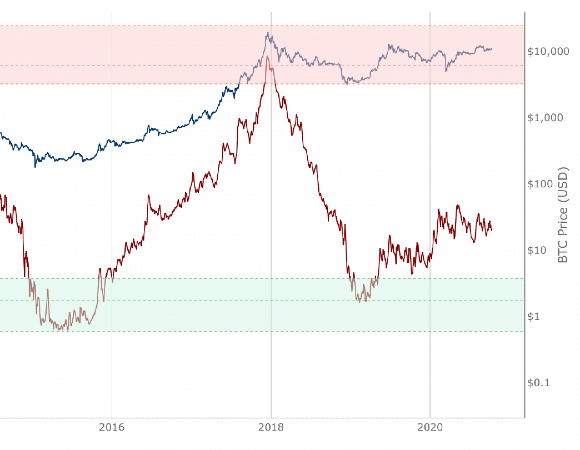
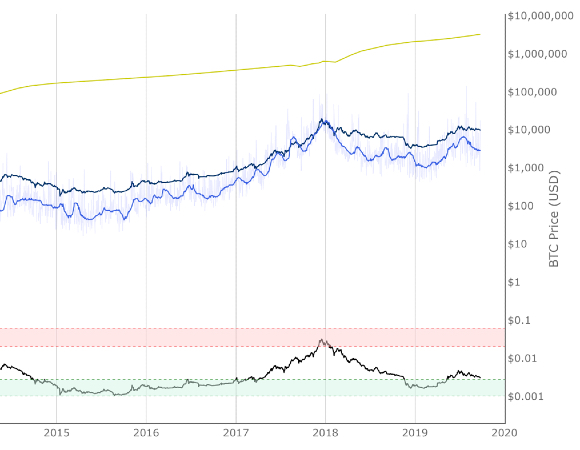
Pulls apart differences between Market Value and Realised Value to identify market cycle highs and lows.
On Chain Indicator using Realized HODL Ratio鈥檚 to identify cycle high price tops.
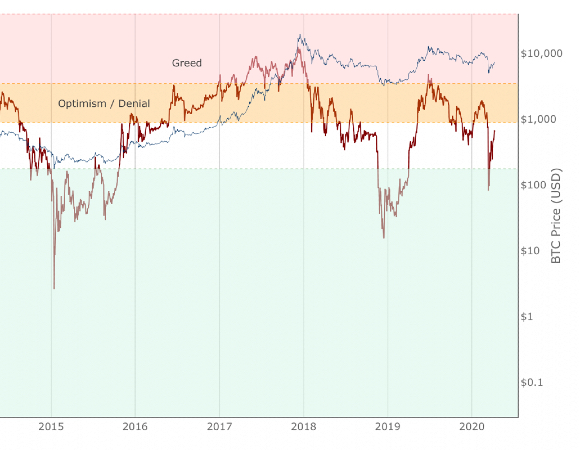
On-chain indicator for investor sentiment market stages
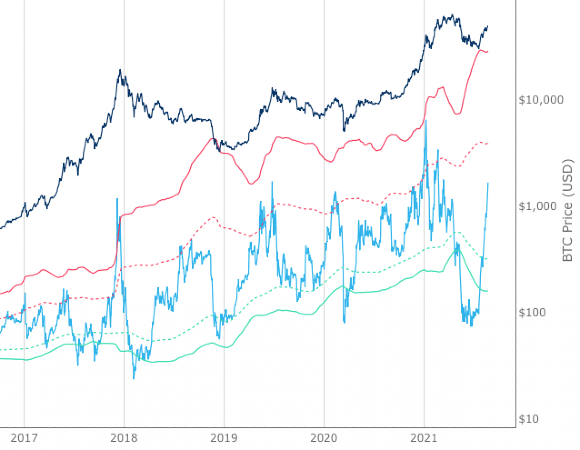
Long term Bitcoin investor confidence relative to Bitcoin price.
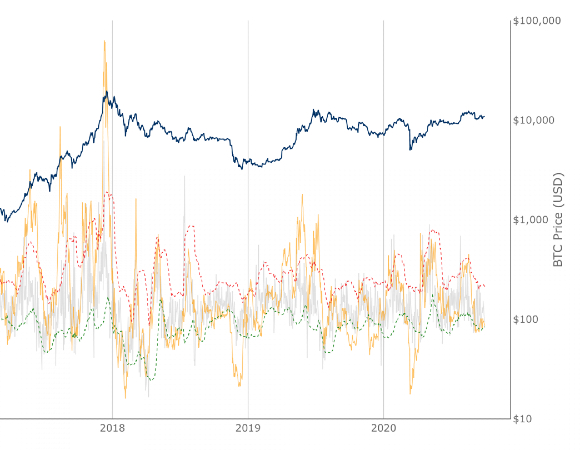
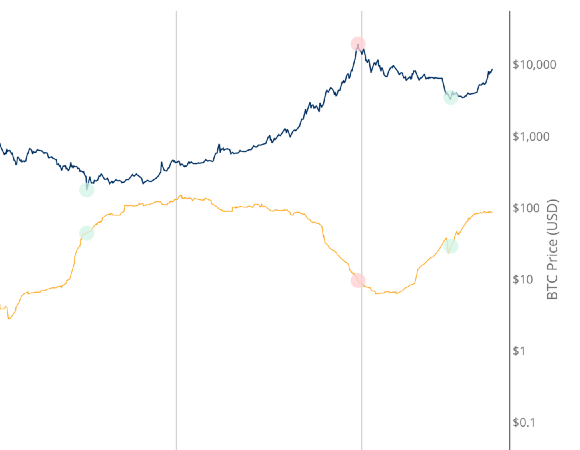
Comparing change in price with change in number of addresses to determine if Bitcoin is over/undervalued in the short term.
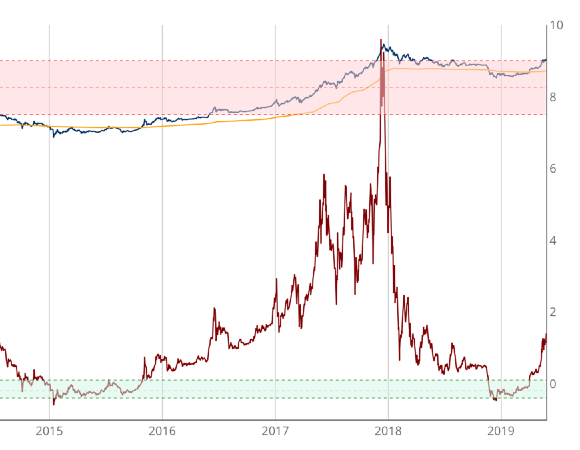
This adaptation of NVT Signal adds standard deviation bands to identify when Bitcoin is overbought or oversold.