Be the first to know when any of the following indicators hit key levels by receiving an exclusive email alert:
Scroll down below to see specific details of alert conditions.
Receive a newsletter once a month that has our analysis of the market using live data charts and other market insight.
The newsletters you will receive forecast where Bitcoin is in its market cycles, and where price may be moving next. They contain macro analysis using on-chain data, cycle analysis, as well as derivative market analysis, so you can understand what is really going on with Bitcoin.
Receive access to 8 private Tradingview indicators for charts from Look Into Bitcoin. Indicators currently available:
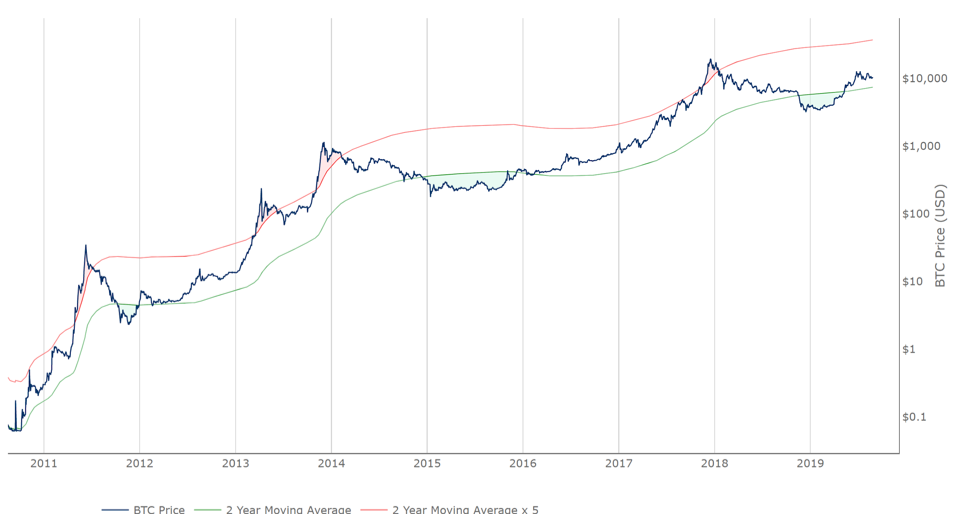
| Bitcoin Investor Tool | |
|---|---|
| Condition | Alert |
| Price crosses above 2yr MA x5 (red line) | Entering overbought zone |
| Price crosses below 2yr MA x5 (red line) | Exiting overbought zone |
| Price crosses below 2yr MA (green line) | Entering oversold zone |
| Price crosses above 2yr MA (green line) | Exiting oversold zone |
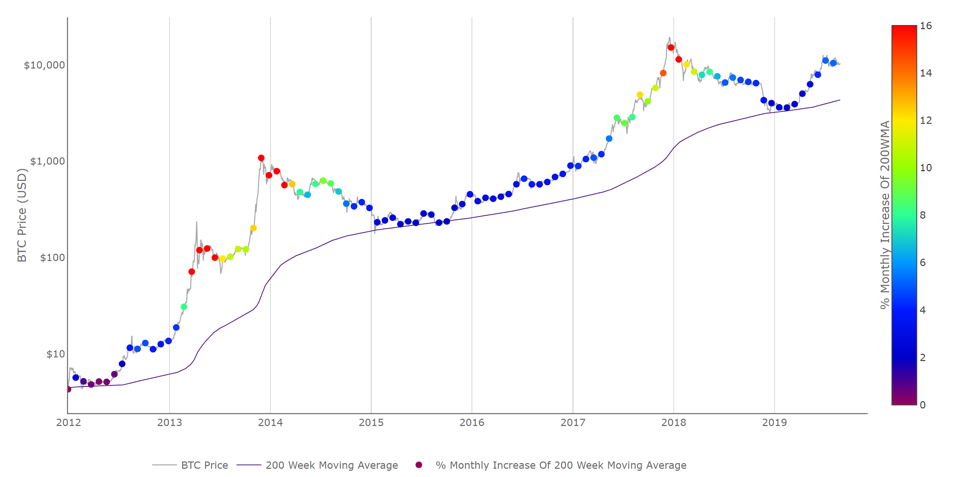
| 200W Moving Average Heatmap | |
|---|---|
| Condition | Alert |
| +7% monthly increase | Entering potential price acceleration period of cycle.В Potential for further upside in coming weeks. |
| +14% monthly increase (orange or red dot on price chart) | Entering overbought zone |
| Drop below +14% monthly increase | Exiting overbought zone |
| Price touching 200WMA | Entering oversold zone |
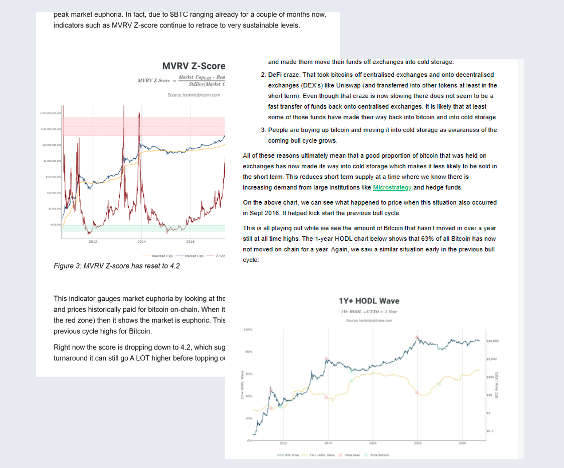
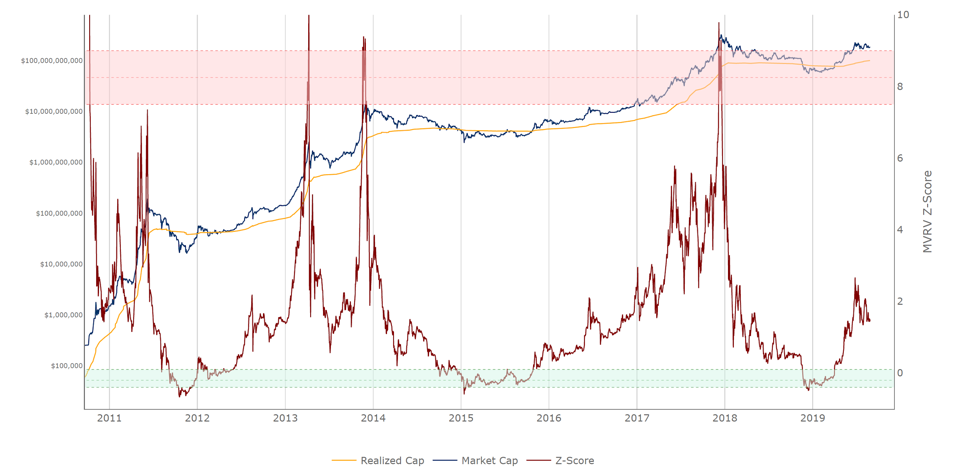
| MVRV Z-Score | |
|---|---|
| Condition | Alert |
| Z-score crosses above 7.5 | Entering overbought zone |
| Z-score crosses below 7.5 | Exiting overbought zone |
| Z-score crosses above 9 | Entering extreme overbought zone |
| Z-score crosses below 9 | Exiting extreme overbought zone |
| Z-score crosses below 0.1 | Entering oversold zone |
| Z-score crosses above 0.1 | Exiting oversold zone |
| Z-score crosses below -0.4 | Entering extreme oversold zone |
| Z-score crosses above -0.4 | Exiting extreme oversold zone |
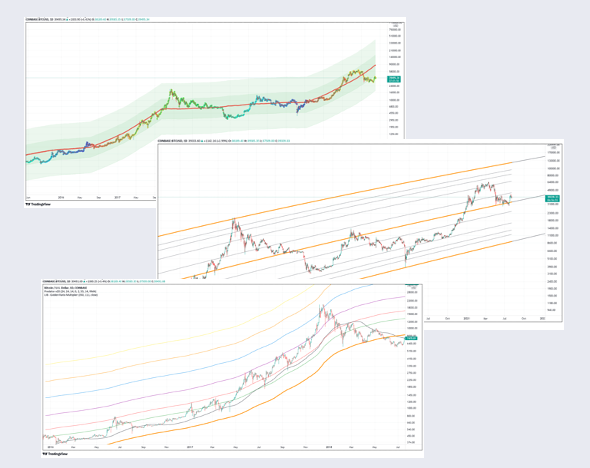
| Golden Ratio Multiplier | |
|---|---|
| Condition | Alert |
| Price crosses above 350DMAx1.6 | Entering potential short term resistance zone |
| Price crosses above 350DMAx2 | Entering overbought zone |
| Price crosses above 350DMAx3 | Reaching major overbought zone - caution |
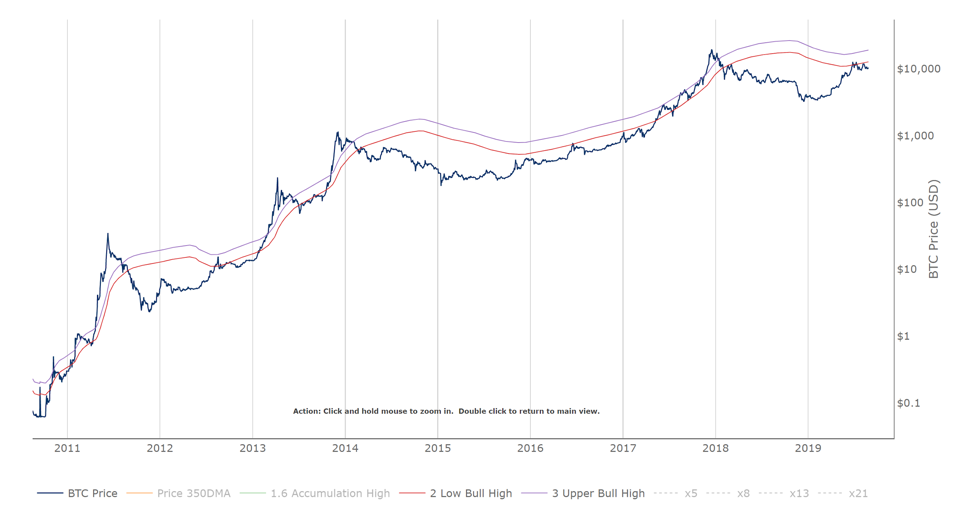
Note: I believe these will be the two most important resistance levels on this indicator for the remainder of this cycle which is why they are included. If this proves to not be the case/once we have completed this cycle I will add more multipliers to this alert.
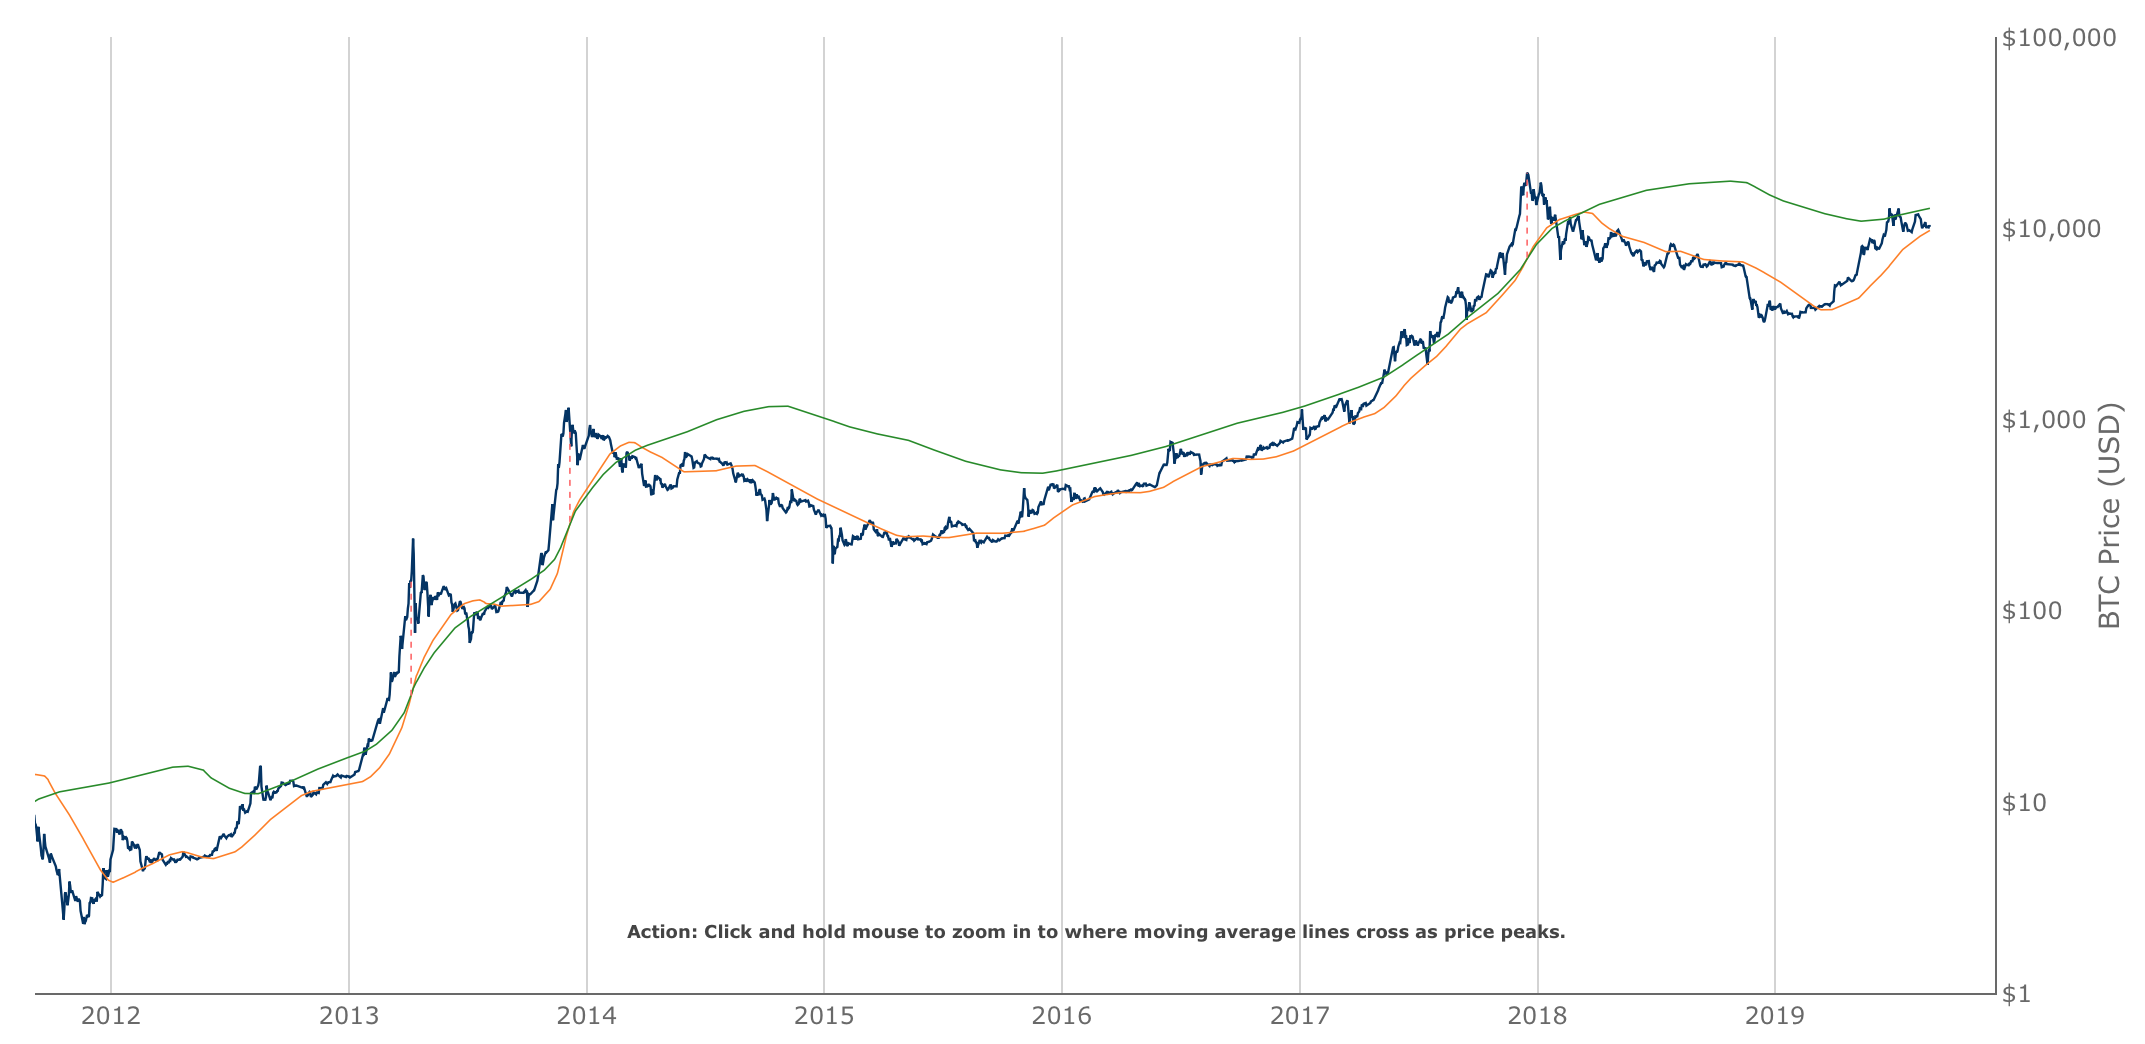
| Pi Cycle Top Indicator | |
|---|---|
| Condition | Alert |
| 111DMA crossing up into 350DMAx2 | Reaching potential cycle high zone |
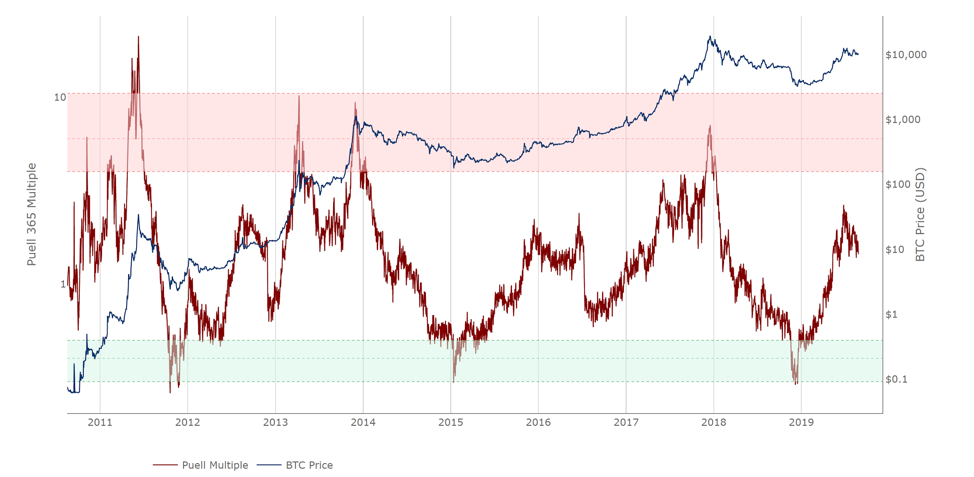
| Puell Multiple | |
|---|---|
| Condition | Alert |
| Puell crosses above 4 | Entering overbought zone |
| Puell crosses below 4 | Exiting overbought zone |
| Puell crosses below 0.5 | Entering oversold zone |
| Puell crosses above 0.5 | Exiting oversold zone |
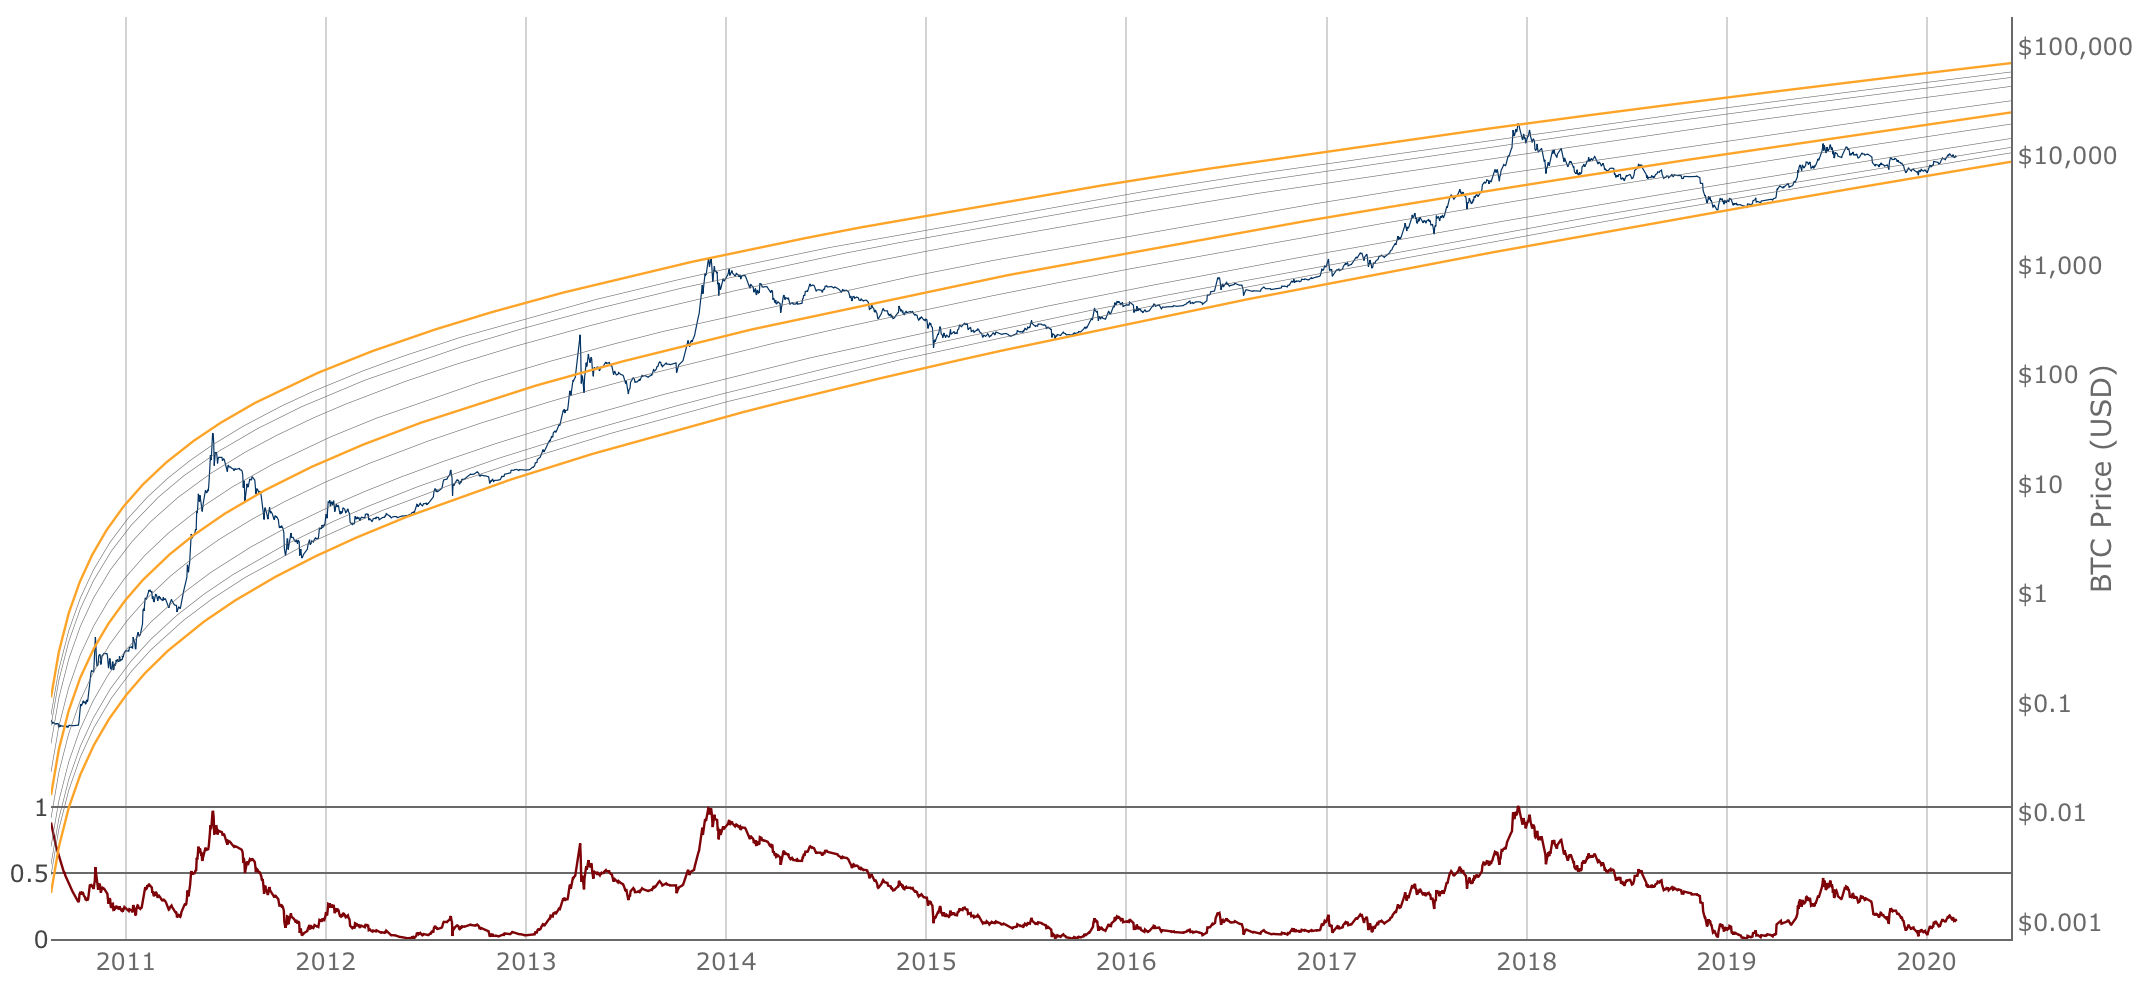
| Logarithmic Growth Curve | |
|---|---|
| Condition | Alert |
| Price approaching top of log channel. Oscillator crossing above 1. | Entering overbought zone |
| Price retracing from top of log channel. Oscillator crossing below 1. | Exiting overbought zone |
| Price reaching middle of log channel. Oscillator crossing above 0.5. | Approaching potential resistance OR cycle parabolic run level |
| Price retracing from middle of log channel. Oscillator crossing below 0.5. | Retracing from potential resistance OR cycle parabolic run level |
| Price approaching bottom of channel. Oscillator crossing below 0. | Entering oversold zone |
| Price exiting bottom of channel. Oscillator crossing above 0. | Exiting oversold zone |
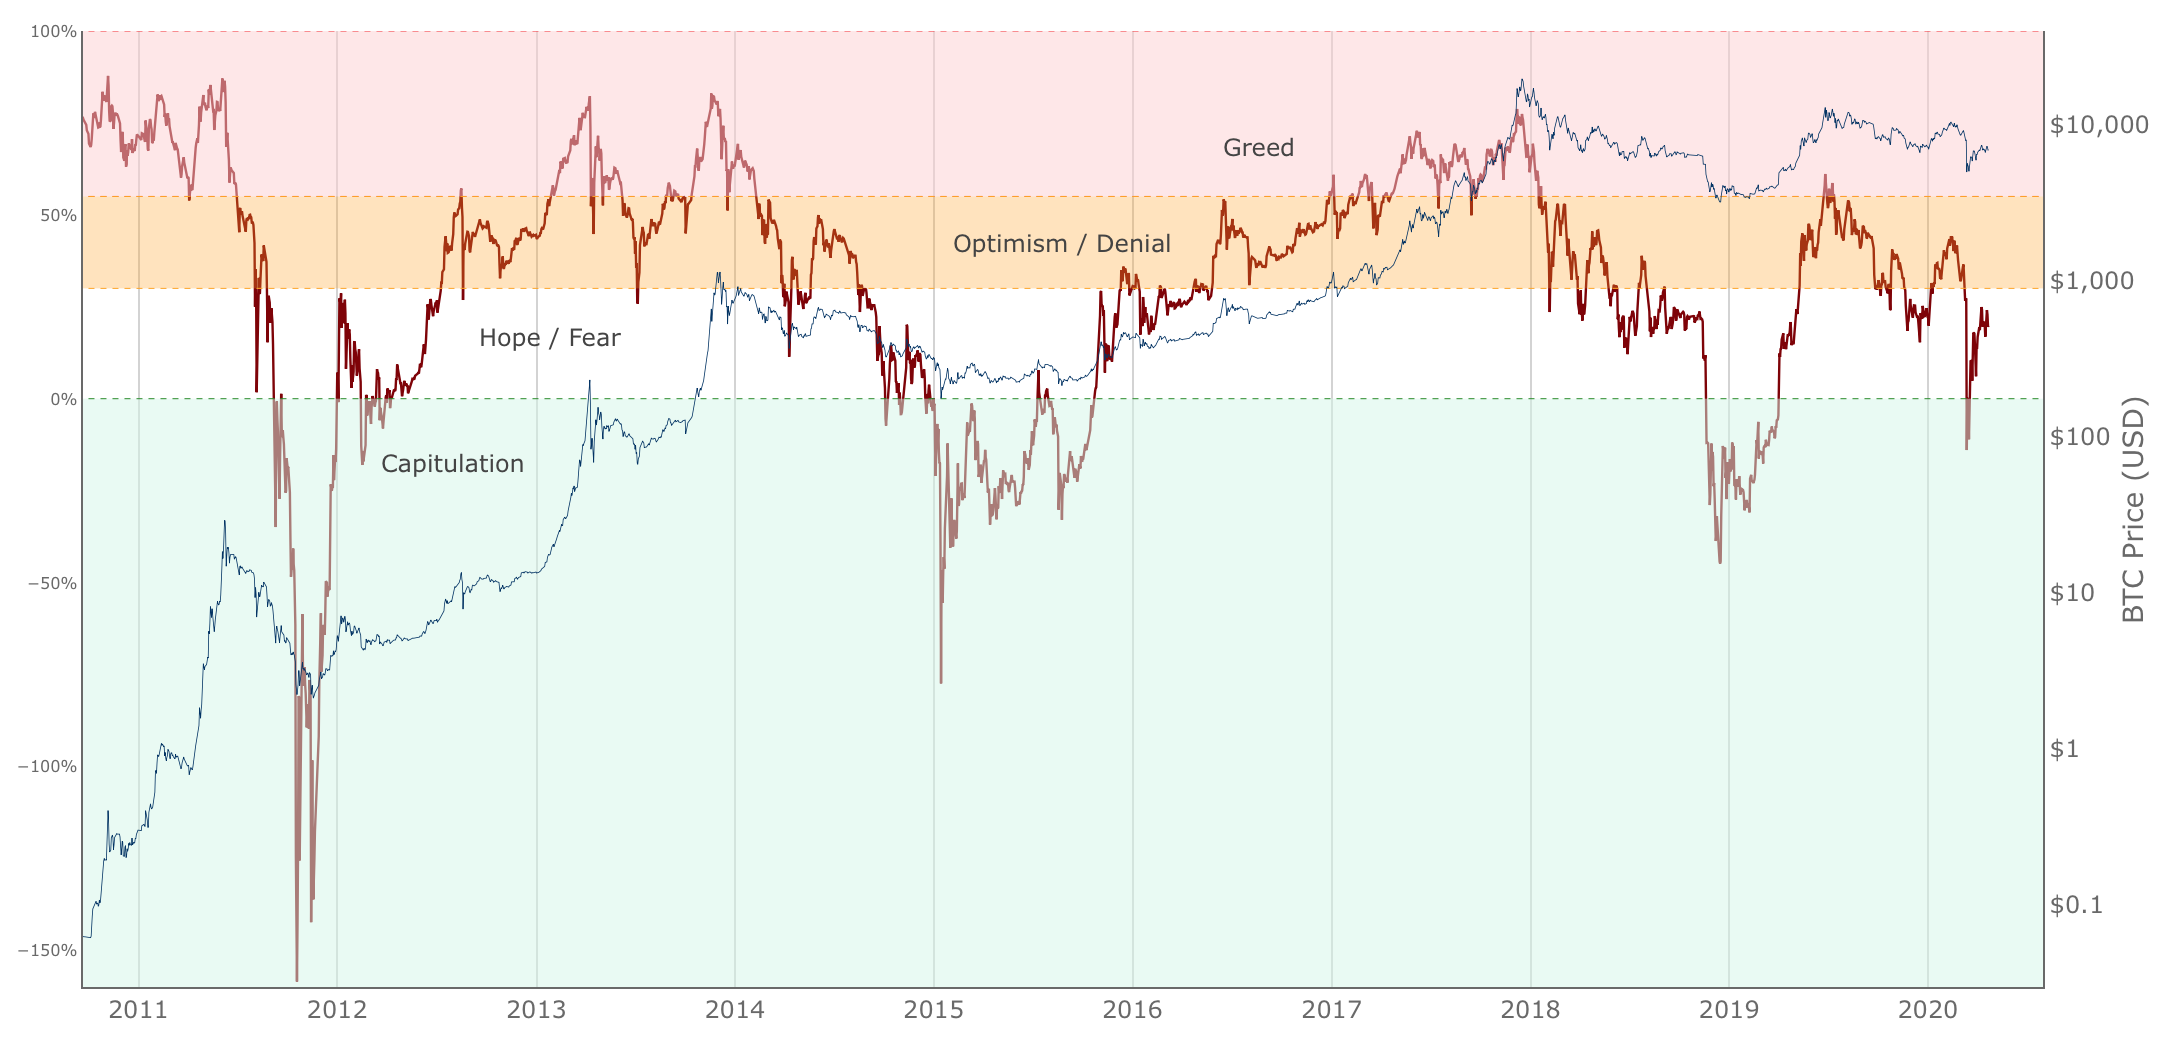
| Relative Unrealized Profit/Loss | |
|---|---|
| Condition | Alert |
| Unrealized Profit/Loss crossing below 0% | Entering Capitulation zone |
| Unrealized Profit/Loss crossing above 0% | Entering Hope / Fear zone |
| Unrealized Profit/Loss crossing below 30% | Entering Hope / Fear zone |
| Unrealized Profit/Loss crossing above 30% | Entering Optimism / Denial zone |
| Unrealized Profit/Loss crossing below 55% | Entering Optimism / Denial zone |
| Unrealized Profit/Loss crossing above 55% | Entering Greed zone |
| Unrealized Profit/Loss crossing below 77% | Entering Greed zone |
| Unrealized Profit/Loss crossing above 77% | Entering Euphoria zone |
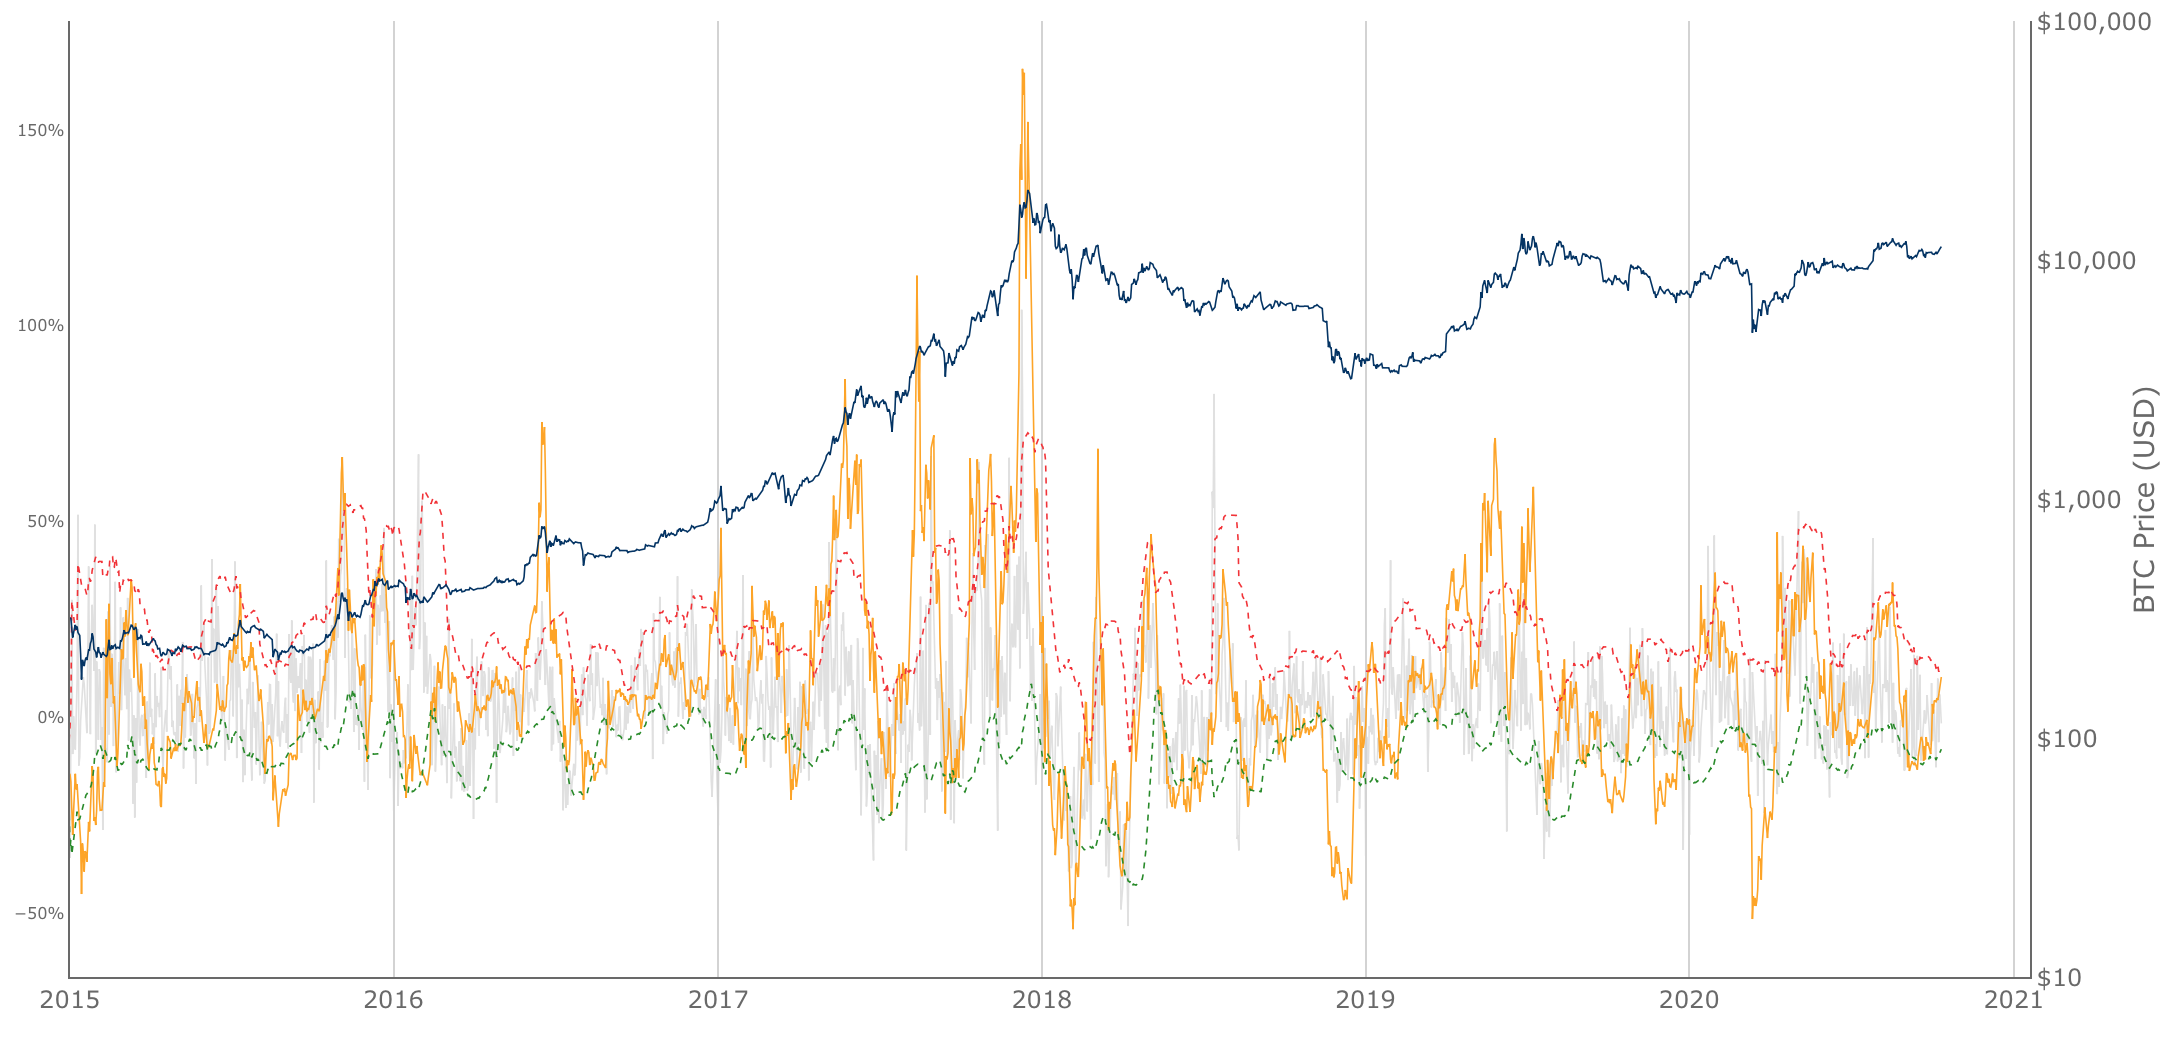
| Active Addresses Sentiment Indicator | |
|---|---|
| Condition | Alert |
| Price change crossing above active addresses upper level | Entering short term overbought zone |
| Price change crossing below active addresses upper level | Exiting short term overbought zone |
| Price change crossing below active addresses lower level | Entering short term oversold zone |
| Price change crossing above active addresses lower level | Exiting short term oversold zone |
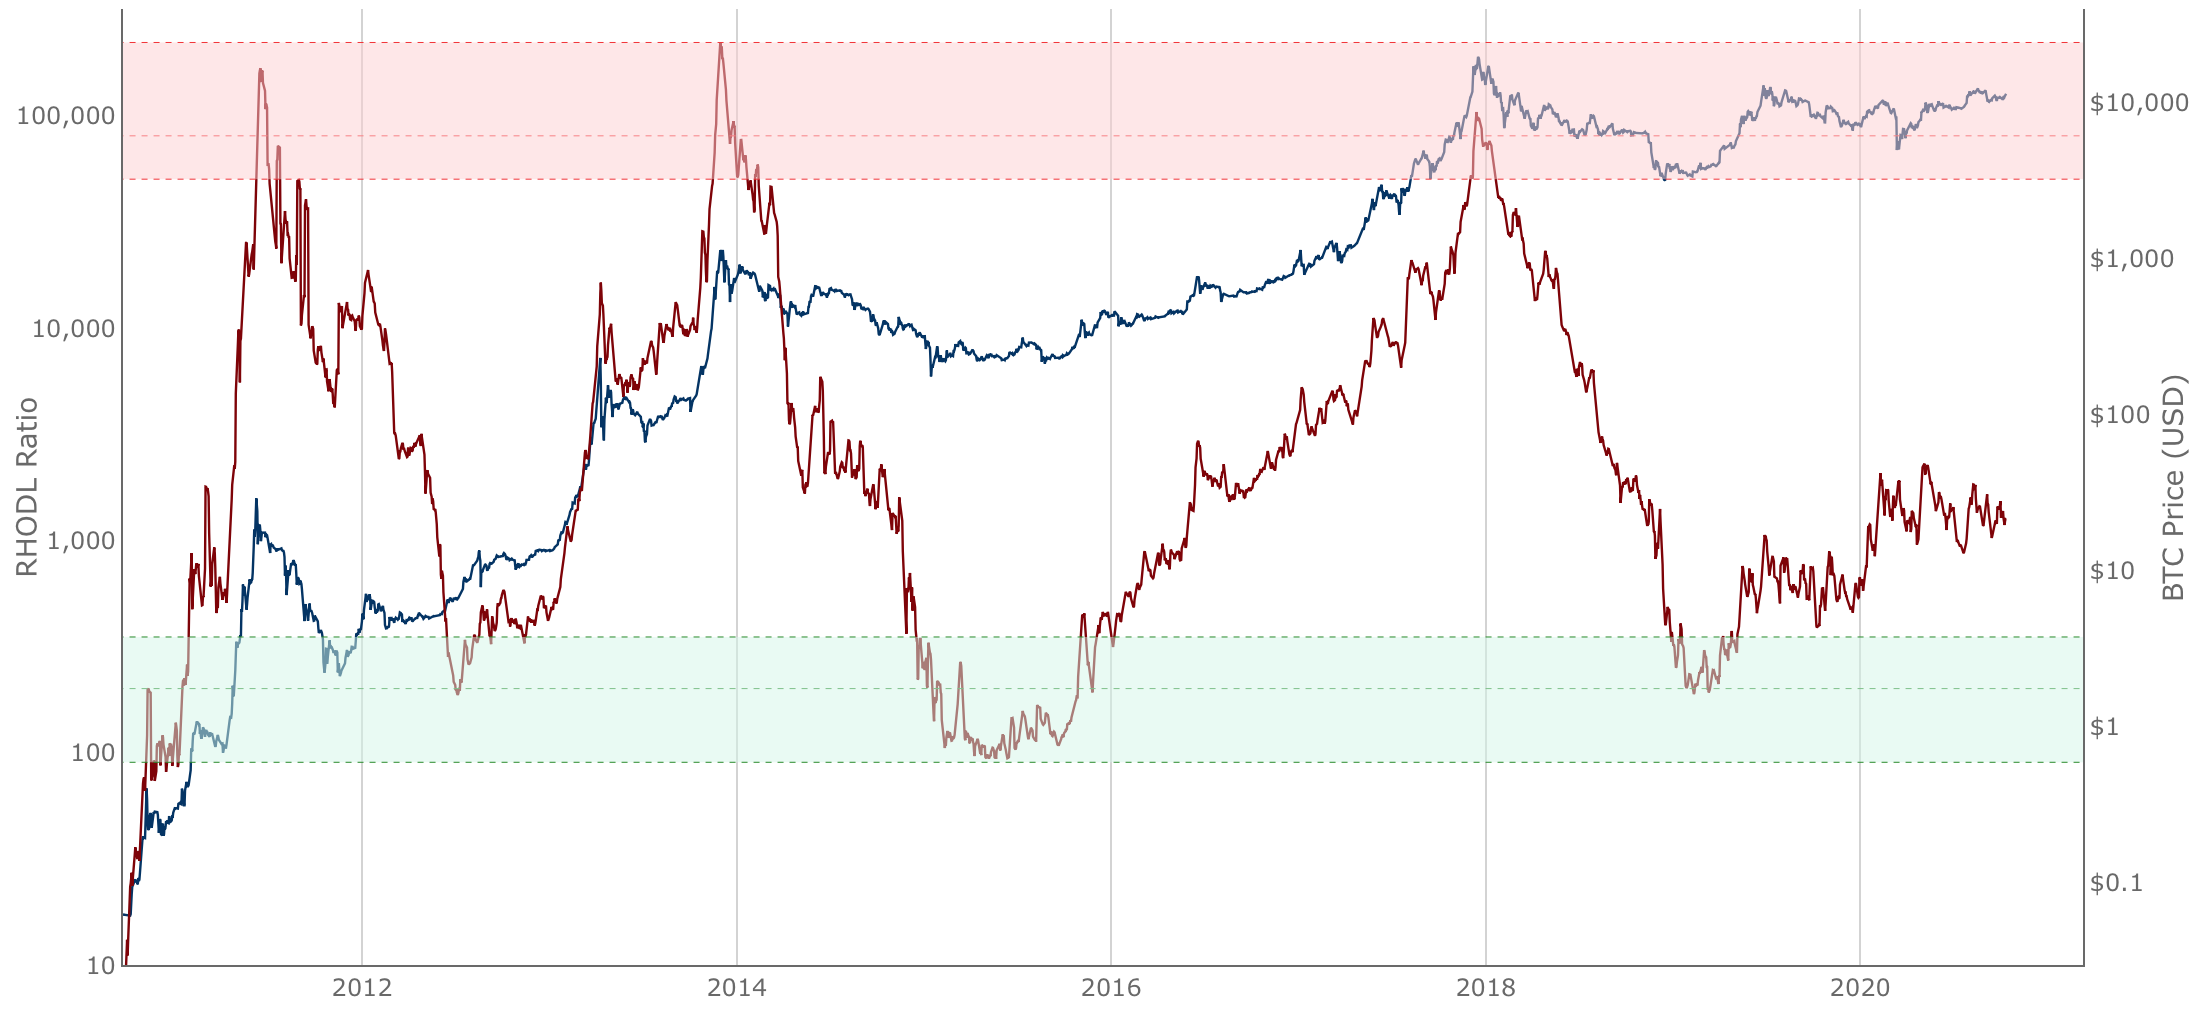
| RHODL Ratio | |
|---|---|
| Condition | Alert |
| RHODL crossing above 80,000 | Entering extreme overbought zone |
| RHODL crossing below 80,000 | Exiting extreme overbought zone |
| RHODL crossing above 50,000 | Entering overbought zone |
| RHODL crossing below 50,000 | Exiting overbought zone |
| RHODL crossing below 200 | Entering extreme oversold zone |
| RHODL crossing above 200 | Exiting extreme oversold zone |
| RHODL crossing below 350 | Entering oversold zone |
| RHODL crossing above 350 | Exiting oversold zone |
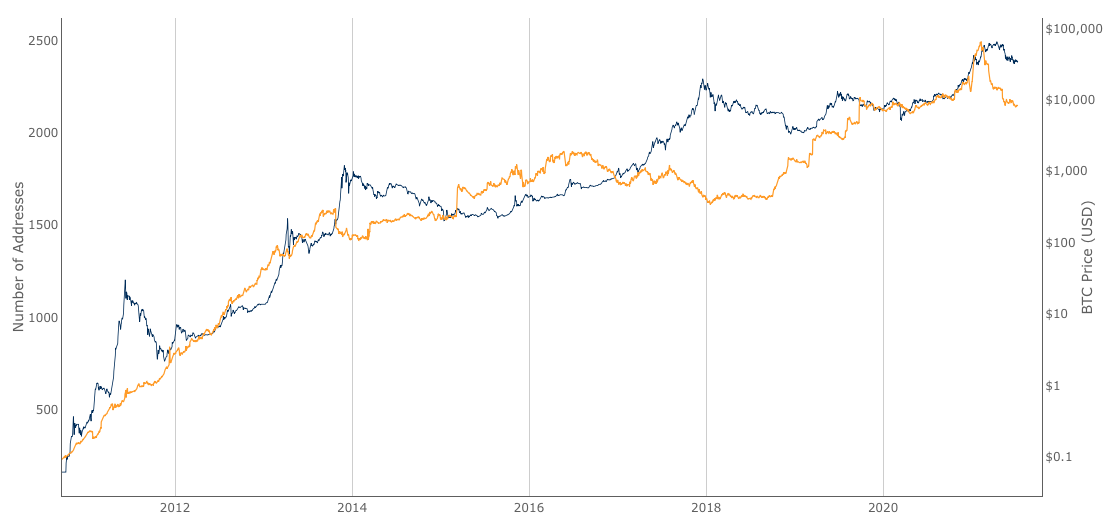
| Wallets > 1,000 BTC | |
|---|---|
| Condition | Alert |
| +5% increase in wallets holding > 1,000 BTC over a 2 week period: Number of large wallets increasing as whales accumulate | Potential bullish signal |
| -5% decrease in wallets holding > 1,000 BTC over a 2 week period: Number of large wallets decreasing | Potential bearish signal |
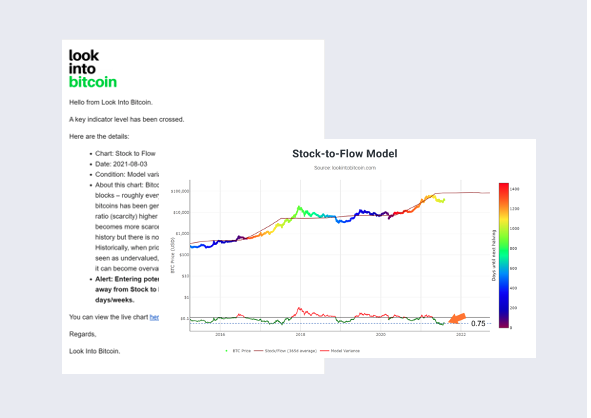
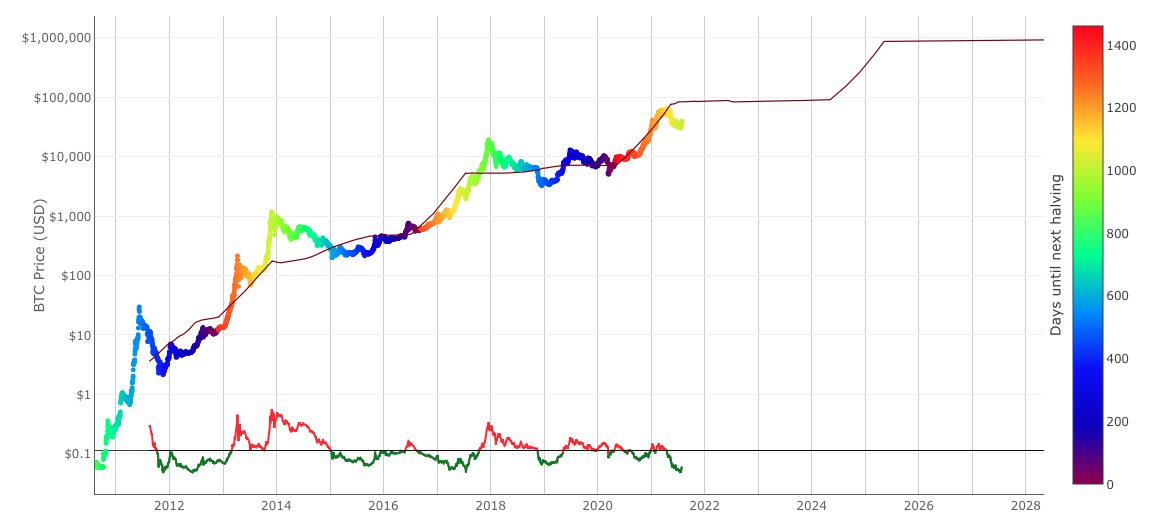
| Stock to Flow | |
|---|---|
| Condition | Alert |
| Model variance moving above -0.75 | Entering potential price acceleration phase of cycle where price catches up with Stock to Flow line.В Potential for further price upside in coming weeks. |
| Model variance moving below -0.75 | Entering potential 'oversold' area where price has deviated far away from Stock to Flow line. Potential for price to bottom in coming days/weeks. |
| Price crossingВ above Stock to Flow line | Price now trading above Stock to flow line 'fair value' level.В Price may become overheated in the coming weeks/months. |
| Model variance moving aboveВ +0.75 | Entering potential 'overbought' area where price has deviated far away from Stock to Flow line. Potential for price to top out in the coming days/weeks. |
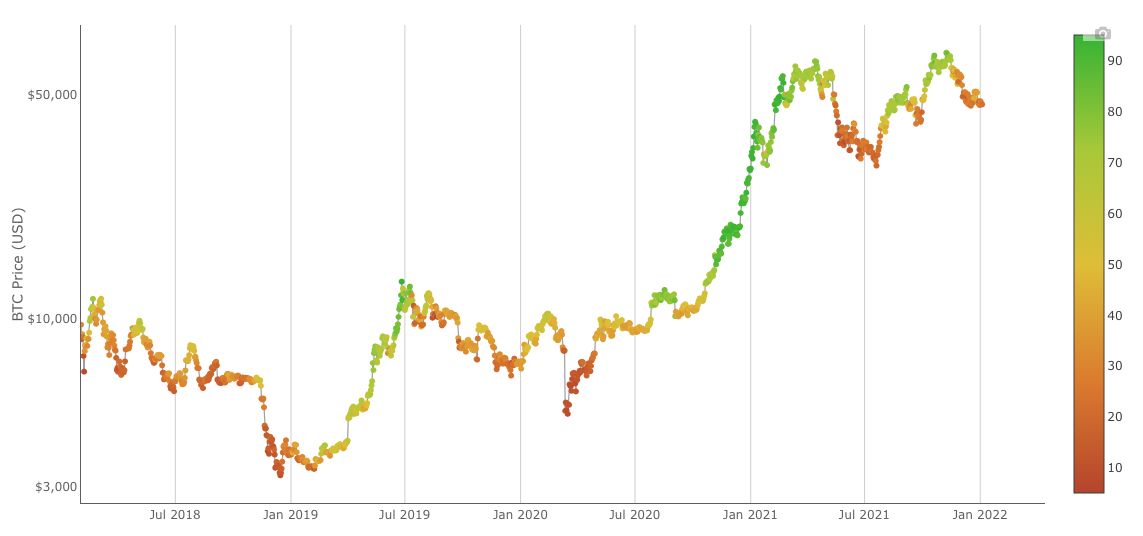
| Bitcoin Fear and Greed Index | |
|---|---|
| Condition | Alert |
| Entering Extreme Greed | Entering Extreme Greed. The market sentiment is currently extremly greedy, often (but not always) this can occur when Bitcoin price is close to approaching its local highs, so may not offer the best opportunity to buy. |
| Entering Extreme Fear | Entering Extreme Fear. The market sentiment is currently extremly fearful, often (but not always) this can occur when Bitcoin price is close to its local lows so may not offer the best opportunity to sell. |
Note: All price/indicator references are to daily close i.e. price/indicator closing below/above a specific level on the daily timeframe.
Scroll back up to gain access.
Any information on this site is not to be considered as financial advice. Please review the Disclaimer section for more information.